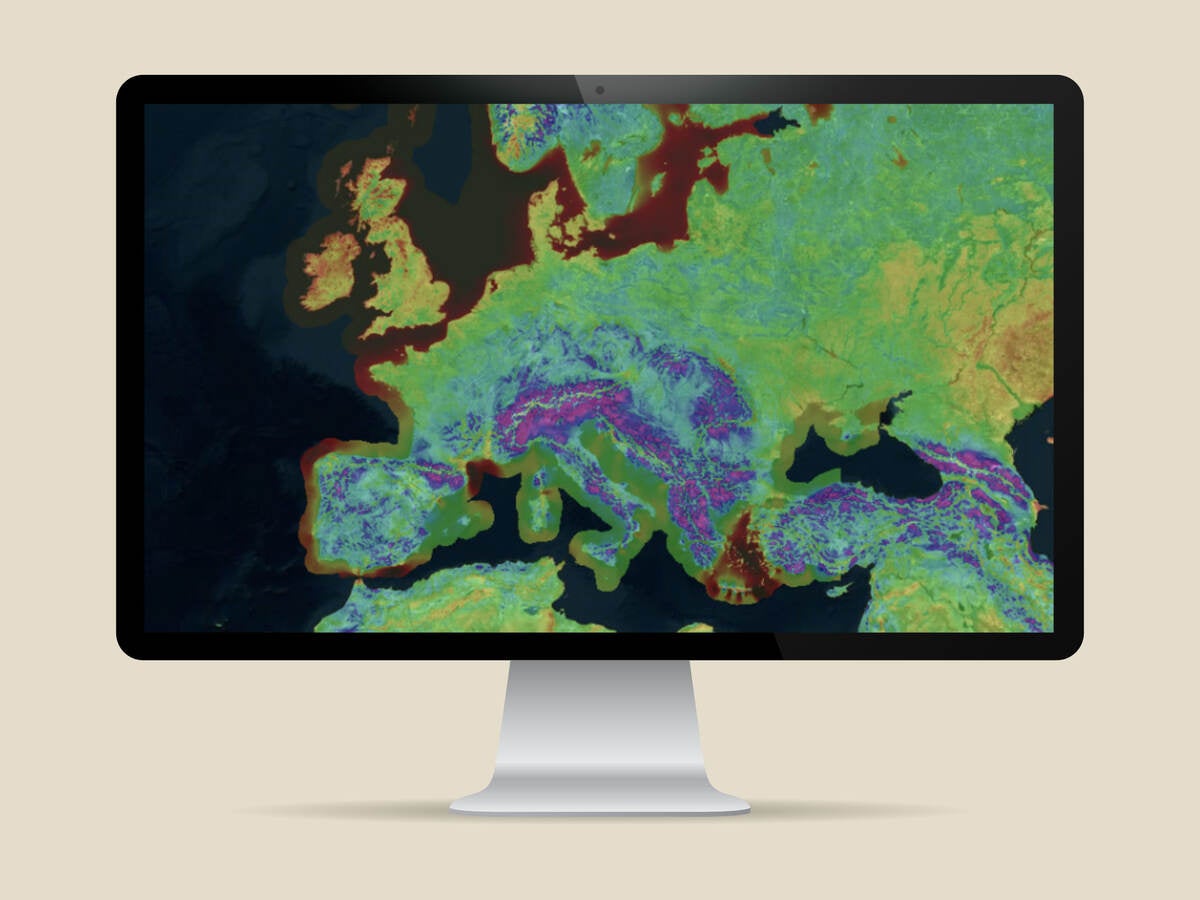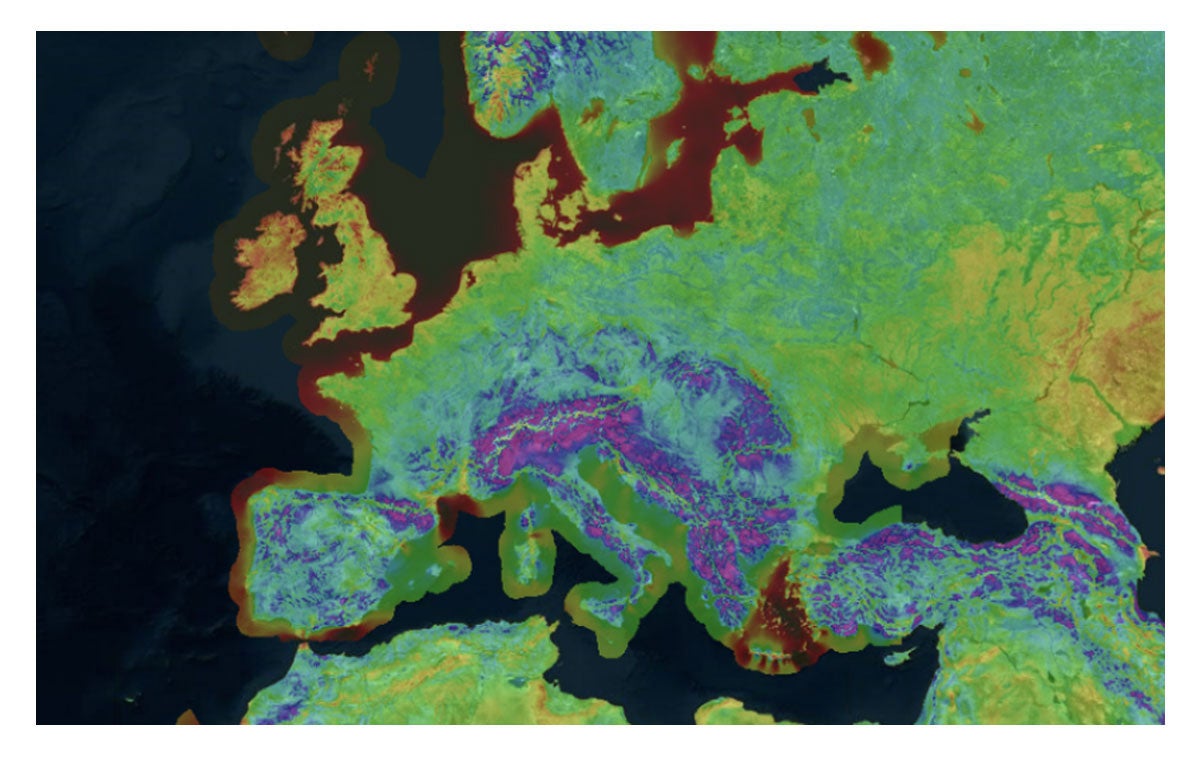
At WindEurope’s Annual Conference in April 2025, UL Solutions will present the 2025 European Wind Map as a major update to the current map which dates from 15 years ago. The 200 m resolution mean wind speed maps are created with UL Solutions’ proprietary wind flow modeling system consisting of a coupled mesoscale and microscale model. The model outputs are subsequently fine-tuned with wind measurements from UL Solutions’ extensive database of meteorological (met) stations.
The new wind map not only provides more accurate data and at higher heights (up to 300 m) but also leverage the latest advancements in wind modeling technology, offering enhanced insights when analyzing and prospecting greenfield sites and assessing competing projects. More specifically, the enhancements designed to help wind developers make more informed decisions include:
- Expanded met data coverage
- 160% the number of observations of the original map
- Includes met data from longer periods of record and higher measurement heights
- More representative and spatially diverse met data in Europe
- Enhanced wind map heights
- Wind maps now available up to 300 m, accommodating taller turbines
- Improved wind modeling and accuracy
- Based on the latest mesoscale modeling and reanalysis dataset
This article briefly describes the methods and models behind the 2025 European wind map. A more detailed white paper will be released in the next months.

Wind resource mapping
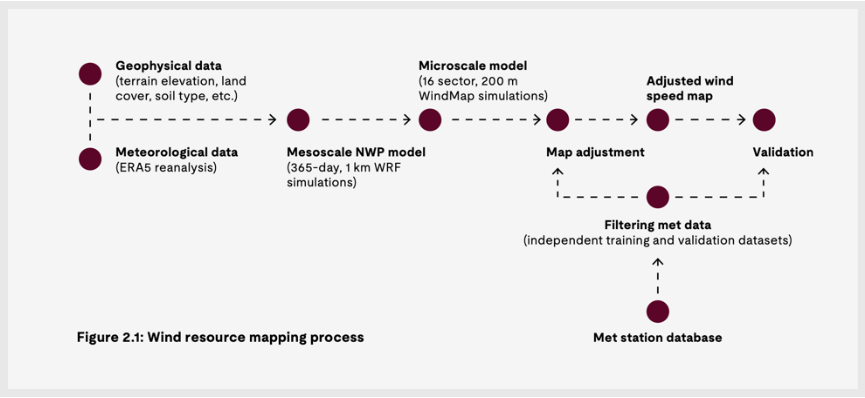
UL Solutions has extensive experience running Numerical Weather Predication (NWP) models such as the Fifth-Generation Penn State/NCAR Mesoscale Model (MM5), Mesoscale Atmospheric Simulation System (MASS), Advanced Regional Prediction System (ARPS) and Weather Research and Forecasting (WRF) models. The next figure provides an overview of the wind mapping process.
While a robust wind flow modeling system is key to creating an accurate wind resource map, a large database of high-quality wind monitoring stations is just as important. The wind measurements are used to anchor the model outputs to ground truth.
Wind flow modeling
The UL Solutions wind flow modeling system is a combination of two atmospheric models: a mesoscale NWP model and a microscale wind flow model. The mesoscale model simulates weather conditions for a representative meteorological year (365 days sampled from a recent 15-year period) on a horizontal grid of 2.5 km. The microscale model then refines the wind fields from the mesoscale model to capture the local influences of topography and surface roughness changes at a resolution of 200 m.
UL Solutions relies on the WRF (Skamarock 2004) model using ERA5 reanalysis, for initial and boundary conditions. NWP models like WRF are the best tools available to simulate the evolving atmospheric conditions, especially the synoptic scale and mesoscale.
The 2.5 km resolution WRF model outputs are then coupled to the microscale model WindMap, which is run with a grid spacing of 200 m. WindMap, developed by UL Solutions, is a mass-conserving model that adjusts an initial wind field, here supplied by WRF, in response to local variations in topography and surface roughness. Thus, WindMap preserves as much information as possible from the mesoscale model fields while adjusting the microscale wind flow to the finer resolution topography and surface roughness maps.
Wind observations
A large database of good quality wind observations is crucial to produce accurate wind resource maps. Thanks to UL Solutions’ long history providing renewable energy consulting going back to the 1980s, we can rely on approximately 700 met stations in Europe. For this wind mapping exercise, we had roughly 160% the number of observations of the original map and with longer periods of record and higher measurement heights.
All data used in adjustment meet highest standards of quality including data flagging, filtering and long-term extrapolation performed by our experts’ team.
Map adjustment
In the map adjustment process, the wind observations in UL Solutions’ database serve to reduce the mean wind speed bias of the map. The mean wind speed map is adjusted using the available wind observations. The objective of this map adjustment is to minimize discrepancies between modeled and observed mean wind speeds.
A smooth regional bias correction is designed to eliminate spatially correlated biases affecting regions of a significant size. This significantly reduces the mean bias error (MBE) and root mean square error (RMSE) while improving the coefficient of determination (R2). In fact, the scatterplots in the next figure demonstrate the advantages of adjusting the raw mean wind speed maps with good quality observations.

Validation of results
For the validation, one met station per cluster that has not been previously used in either the original map or the 2025 map is used to establish a fair comparison between the maps. The results will be presented at Wind Europe and show a very significant improvement with regards to the baselines for comparison (Global Wind Atlas and the original UL Solutions map) in all variables: MBE, MSE and R2.
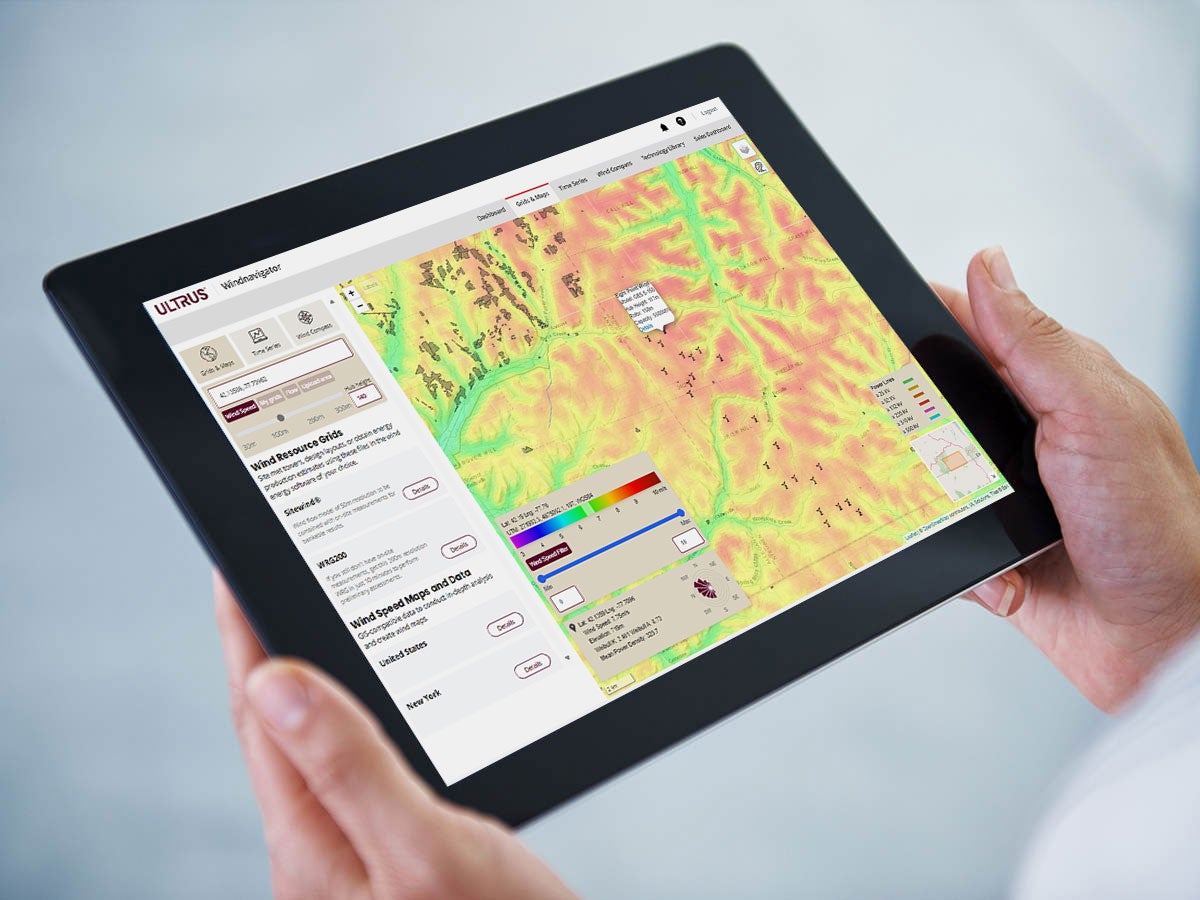
UL Solutions is working to incorporate the new European wind map into the ULTRUS™ Windnavigator Resource Data and Maps software, allowing customers access to more accurate maps and grids for Europe. The plan includes a partial release during the WindEurope event; customers will be able to order these new maps starting April 8, 2025. The updated maps will be accessible in the Windnavigator software at a later date.
Get connected with our sales team
Thanks for your interest in our products and services. Let's collect some information so we can connect you with the right person.

