February 20, 2025
Fourth Quarter 2024 (Comparisons to Fourth Quarter 2023 unless otherwise noted)1
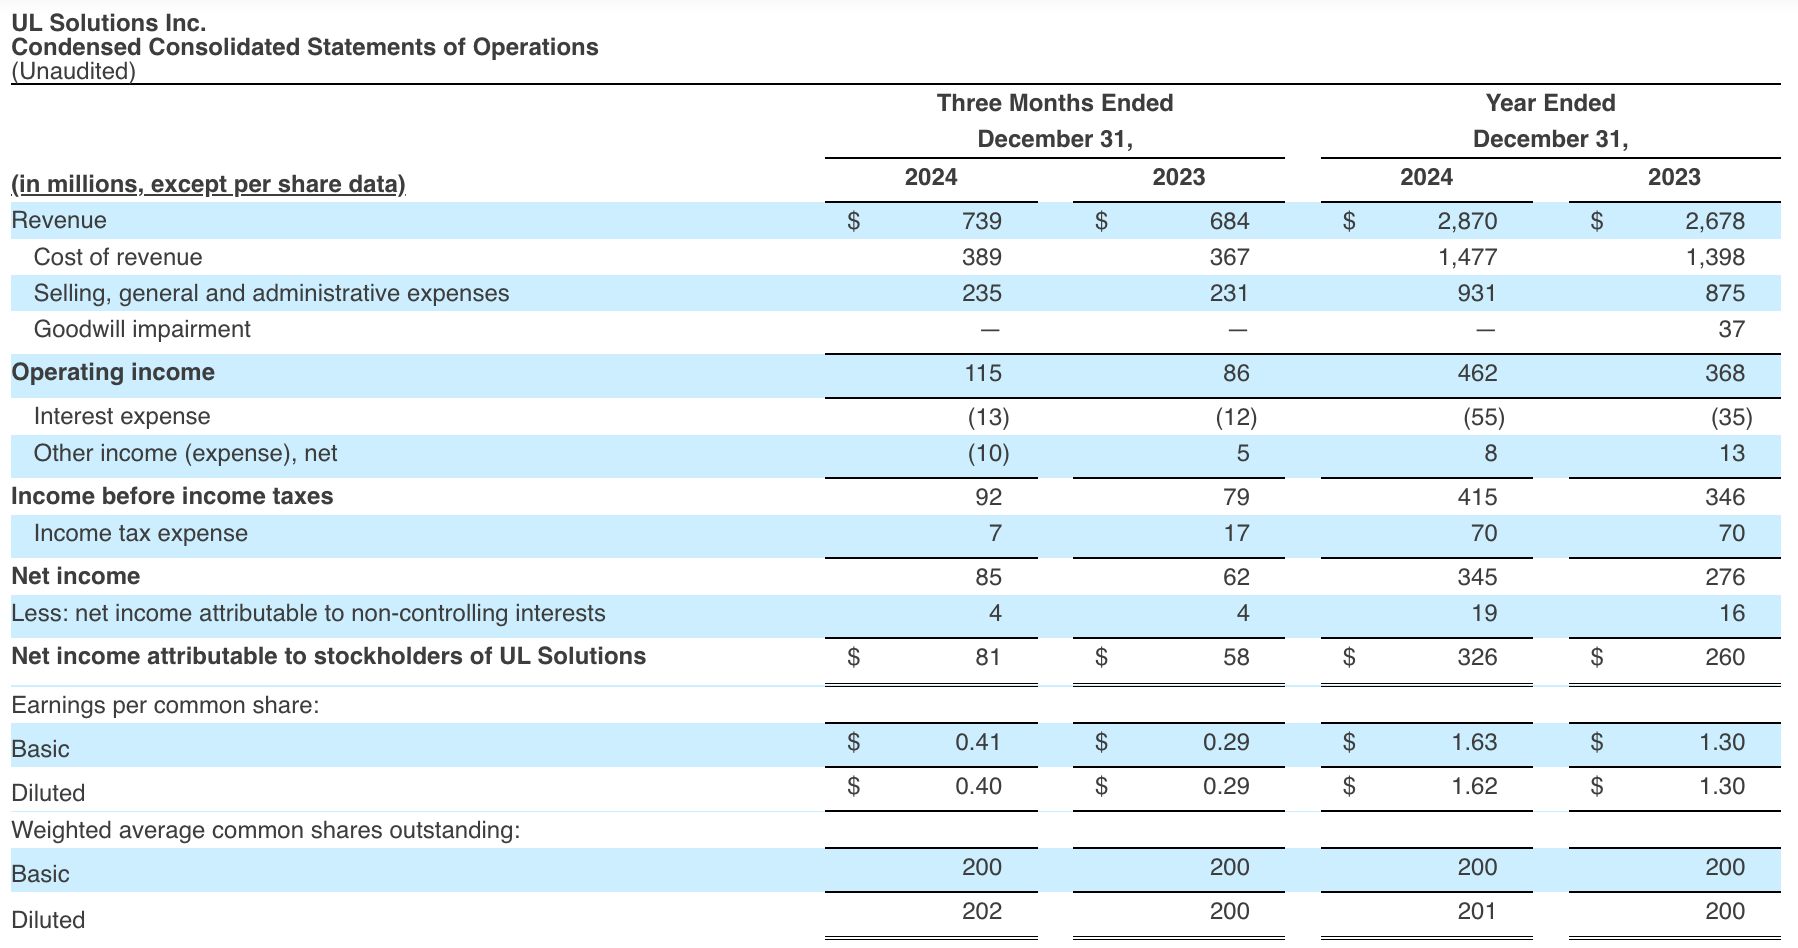
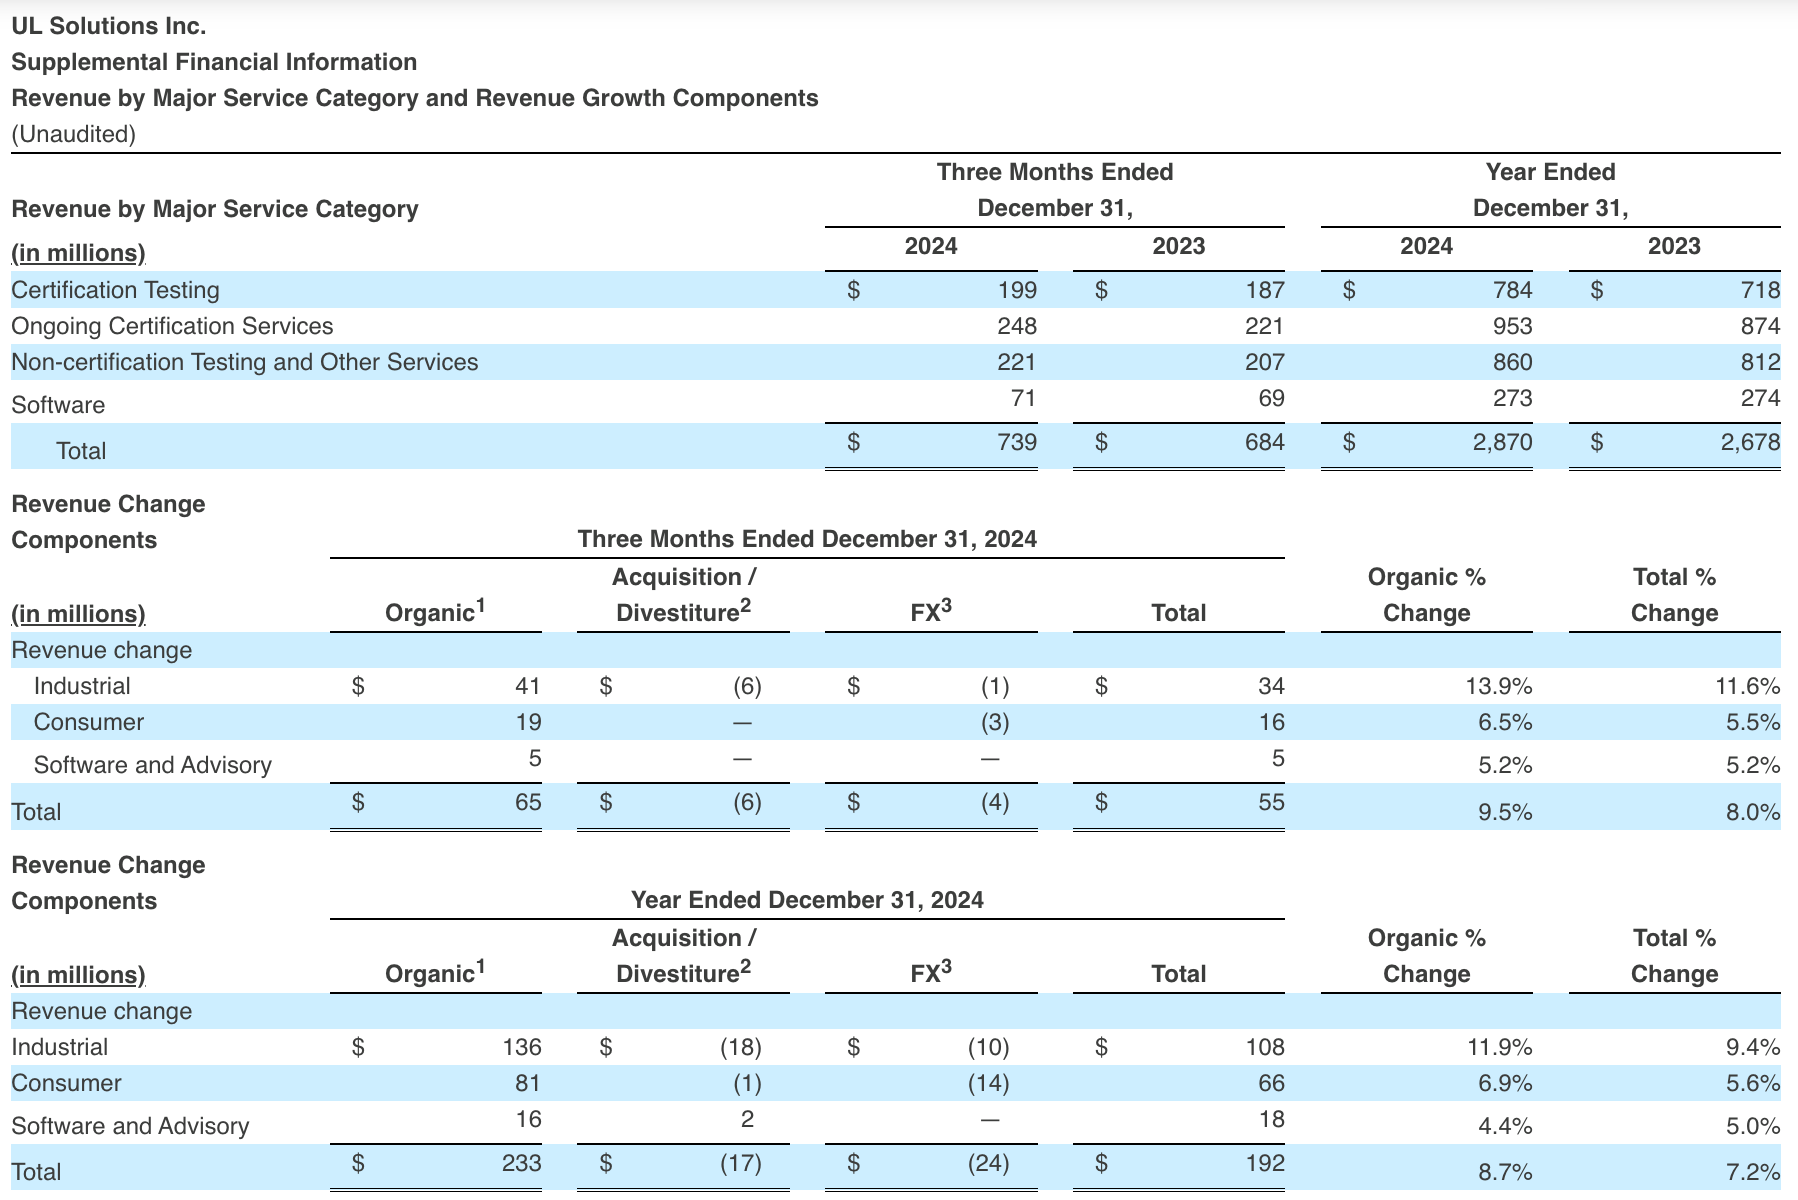
- Strong revenue growth of 8.0% to $739 million, including 9.5% organic growth
- Net income of $85 million increased 37.1%, Net income margin of 11.5%, expanded 240 basis points
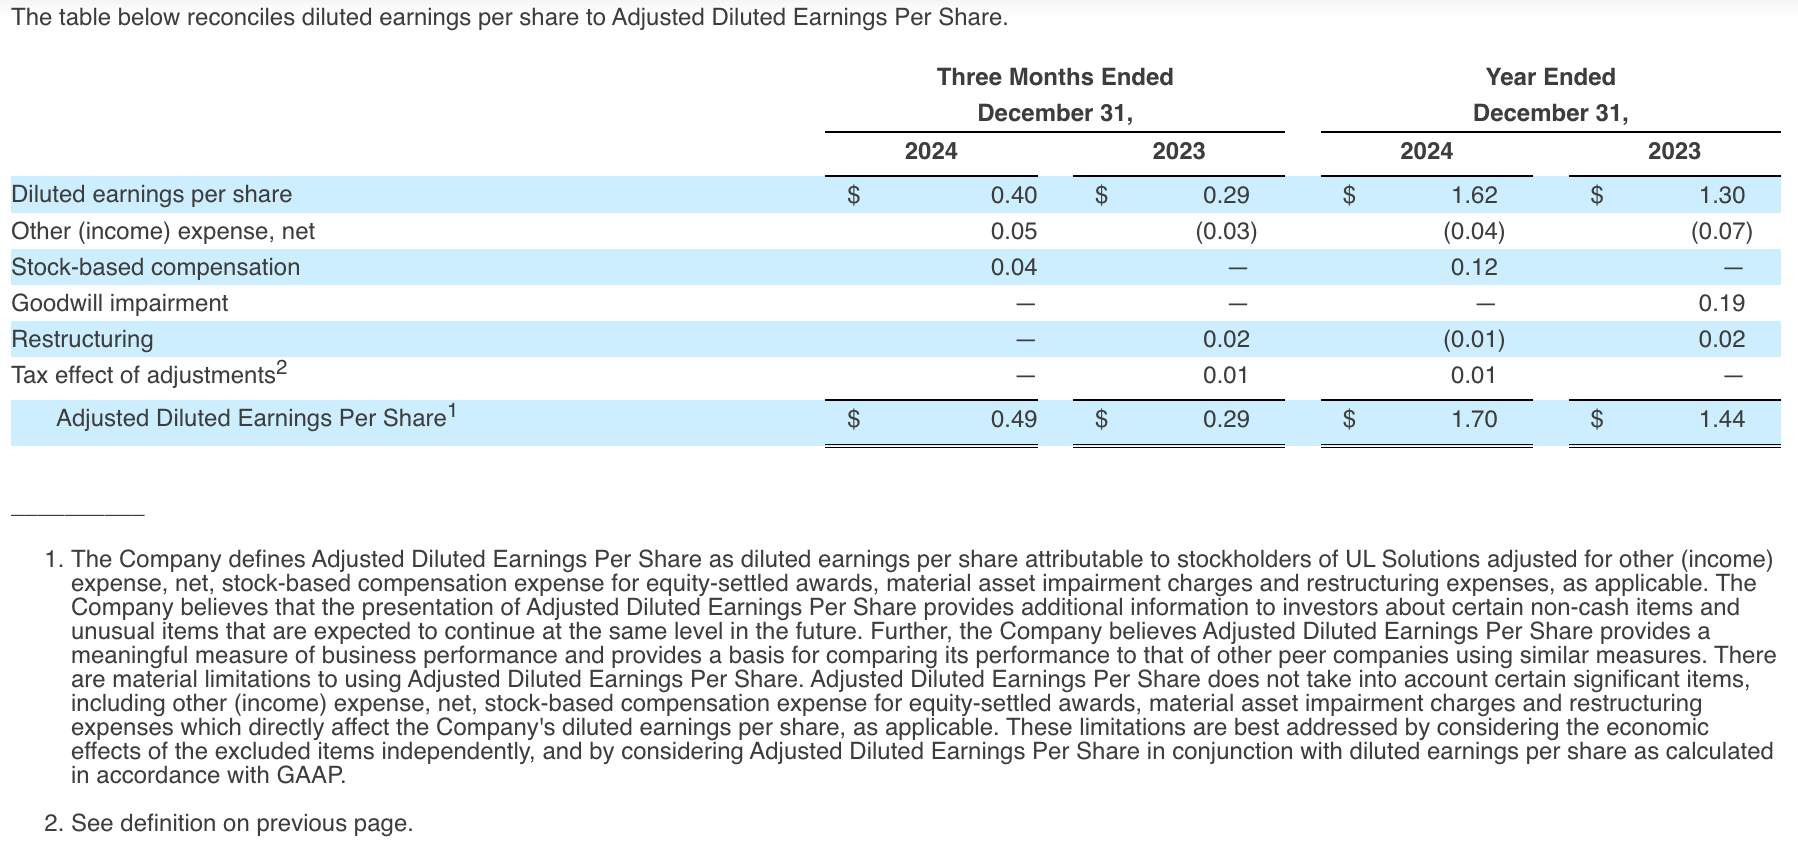
- Diluted earnings per share of $0.40 increased 37.9%, Adjusted Diluted Earnings Per Share of $0.49 increased 69.0%
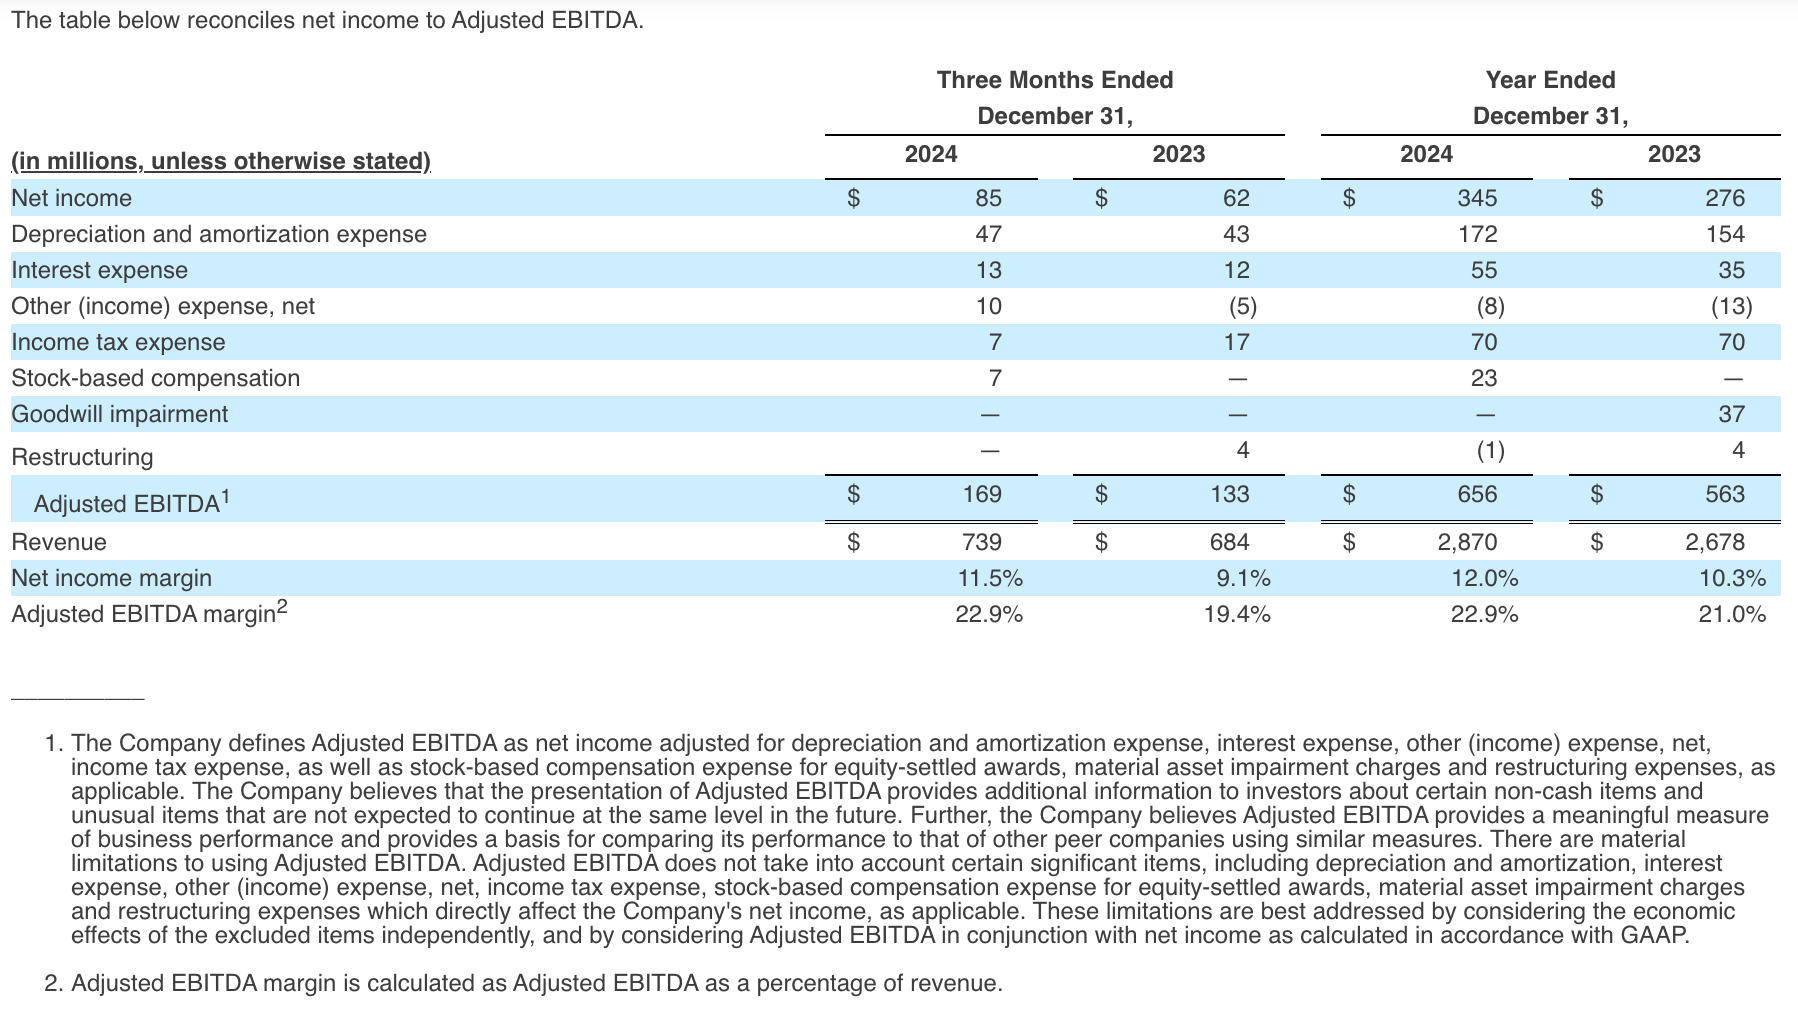
- Adjusted EBITDA of $169 million increased 27.1%, Adjusted EBITDA margin of 22.9% expanded 350 basis points
Full Year 2024 (Comparisons to Full Year 2023 unless otherwise noted)1
- Strong revenue growth of 7.2% to $2.9 billion, including 8.7% organic growth
- Net income of $345 million increased 25.0%, Net income margin of 12.0%, expanded 170 basis points
- Diluted earnings per share of $1.62 increased 24.6%, Adjusted Diluted Earnings Per Share of $1.70 increased 18.1%
- Adjusted EBITDA of $656 million increased 16.5%, Adjusted EBITDA margin of 22.9% expanded 190 basis points
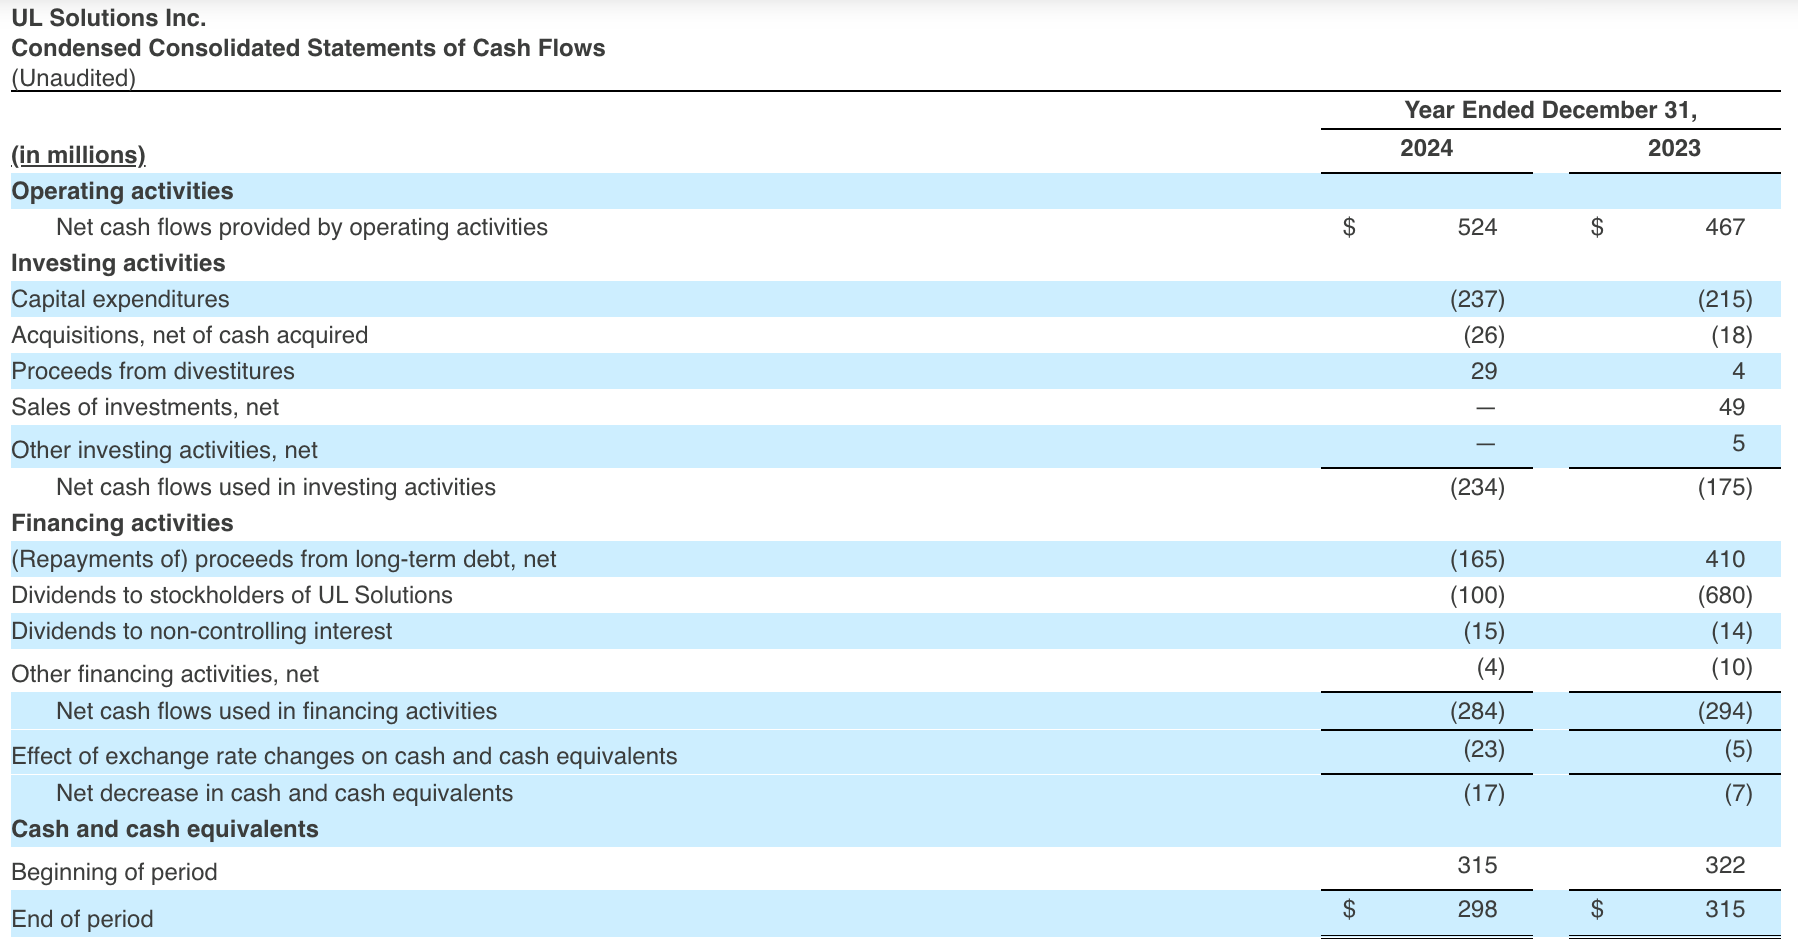
- Net cash provided by operating activities of $524 million and Free Cash Flow of $287 million for the year ended December 31, 2024
- Successfully completed Initial Public Offering in April
- Introduces 2025 growth outlook
NORTHBROOK, ILLINOIS, February 20, 2025 — UL Solutions Inc. (NYSE: ULS), a global safety science leader in independent third-party testing, inspection and certification services and related software and advisory offerings, today reported results for the fourth quarter and full year ended December 31, 2024.
“I’m incredibly proud of our team for the strong fourth quarter results that capped off a remarkable first year as a public company, with sustained momentum across all segments, service lines and regions,” said President and CEO Jennifer Scanlon. “Robust organic revenue growth, margin expansion and strong cash flow generation underscored the resilience and predictability of our business model, along with the growth drivers propelling us forward.”
Scanlon continued, “Our close customer relationships and recent investments in advanced testing facilities worldwide are already delivering results for UL Solutions as we help companies in many industries navigate complex regulatory requirements and their own business challenges. As safety science evolves and new technologies emerge, we remain committed to our mission of working for a safer, more secure and sustainable world.”
“For the full year we generated robust net cash provided by operating activities of $524 million, Free Cash Flow of $287 million and finished with strong liquidity and an investment grade balance sheet," said Chief Financial Officer Ryan Robinson. “Looking ahead to 2025, we expect to achieve mid-single digit constant currency organic revenue growth while further improving our Adjusted EBITDA margins. We will continue investing to expand our capabilities that align with global megatrends while maintaining our disciplined approach to capital allocation.”
1 This press release includes references to non-GAAP financial measures. Please refer to “Non-GAAP Financial Measures” later in this release for the definitions of each non-GAAP financial measures presented, as well as reconciliations of these measures to their most directly comparable GAAP measures.
Fourth Quarter 2024 Financial Results
Revenue of $739 million compared to $684 million in the fourth quarter of 2023, an increase of 8.0%. Organic growth of 9.5% across all segments, led by Industrial and Consumer segments.
Net income of $85 million compared to $62 million in the fourth quarter of 2023, an increase of 37.1%. Net income margin of 11.5% compared to 9.1% in the fourth quarter of 2023, an increase of 240 basis points. The margin expansion resulted from higher revenue and improved operating leverage, led by the Industrial segment.
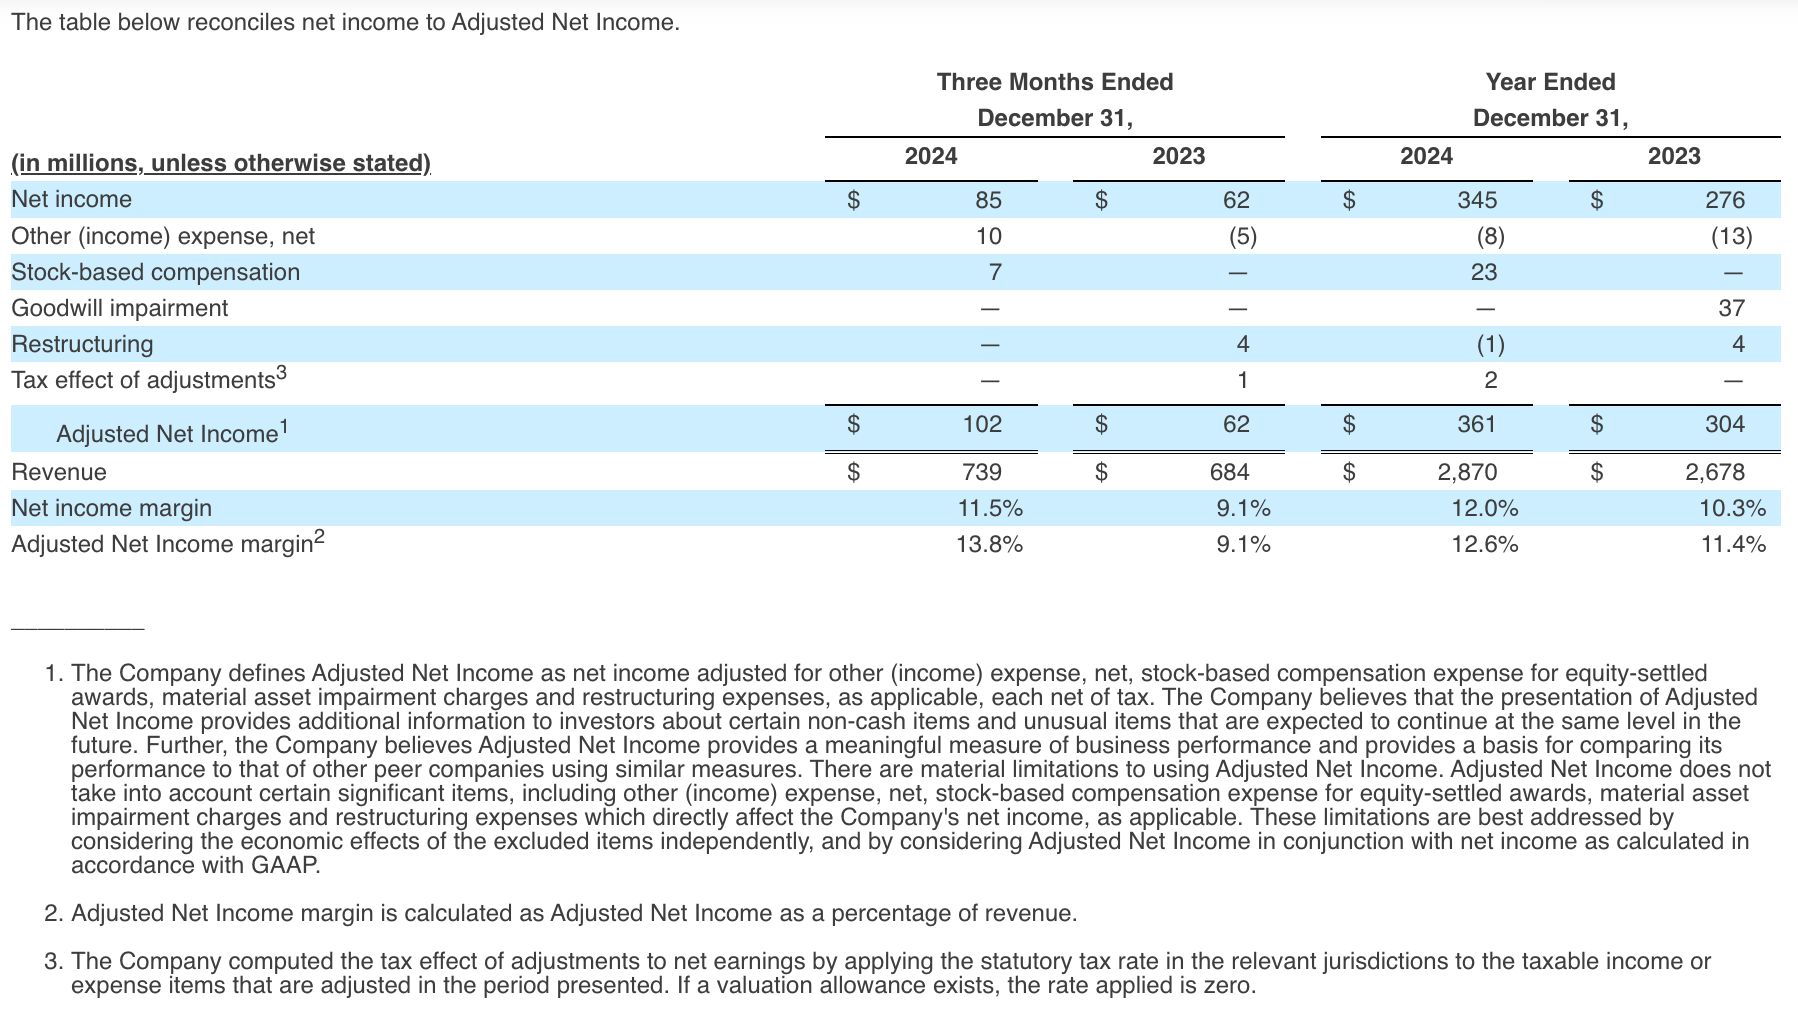
Adjusted Net Income of $102 million compared to $62 million in the fourth quarter of 2023, an increase of 64.5%. Adjusted Net Income margin of 13.8% compared to 9.1% in the fourth quarter of 2023, an increase of 470 basis points.
Diluted earnings per share of $0.40 compared to $0.29 in the fourth quarter of 2023, an increase of $0.11. Adjusted Diluted Earnings Per Share of $0.49 compared to $0.29 in the fourth quarter of 2023, an increase of $0.20.
Adjusted EBITDA of $169 million compared to $133 million in the fourth quarter of 2023, an increase of 27.1%. Adjusted EBITDA margin of 22.9% compared to 19.4% in the fourth quarter of 2023, an increase of 350 basis points. The margin expansion resulted from higher revenue and improved operating leverage, led by the Industrial segment.
Fourth Quarter 2024 Segment Performance
Industrial Segment Results
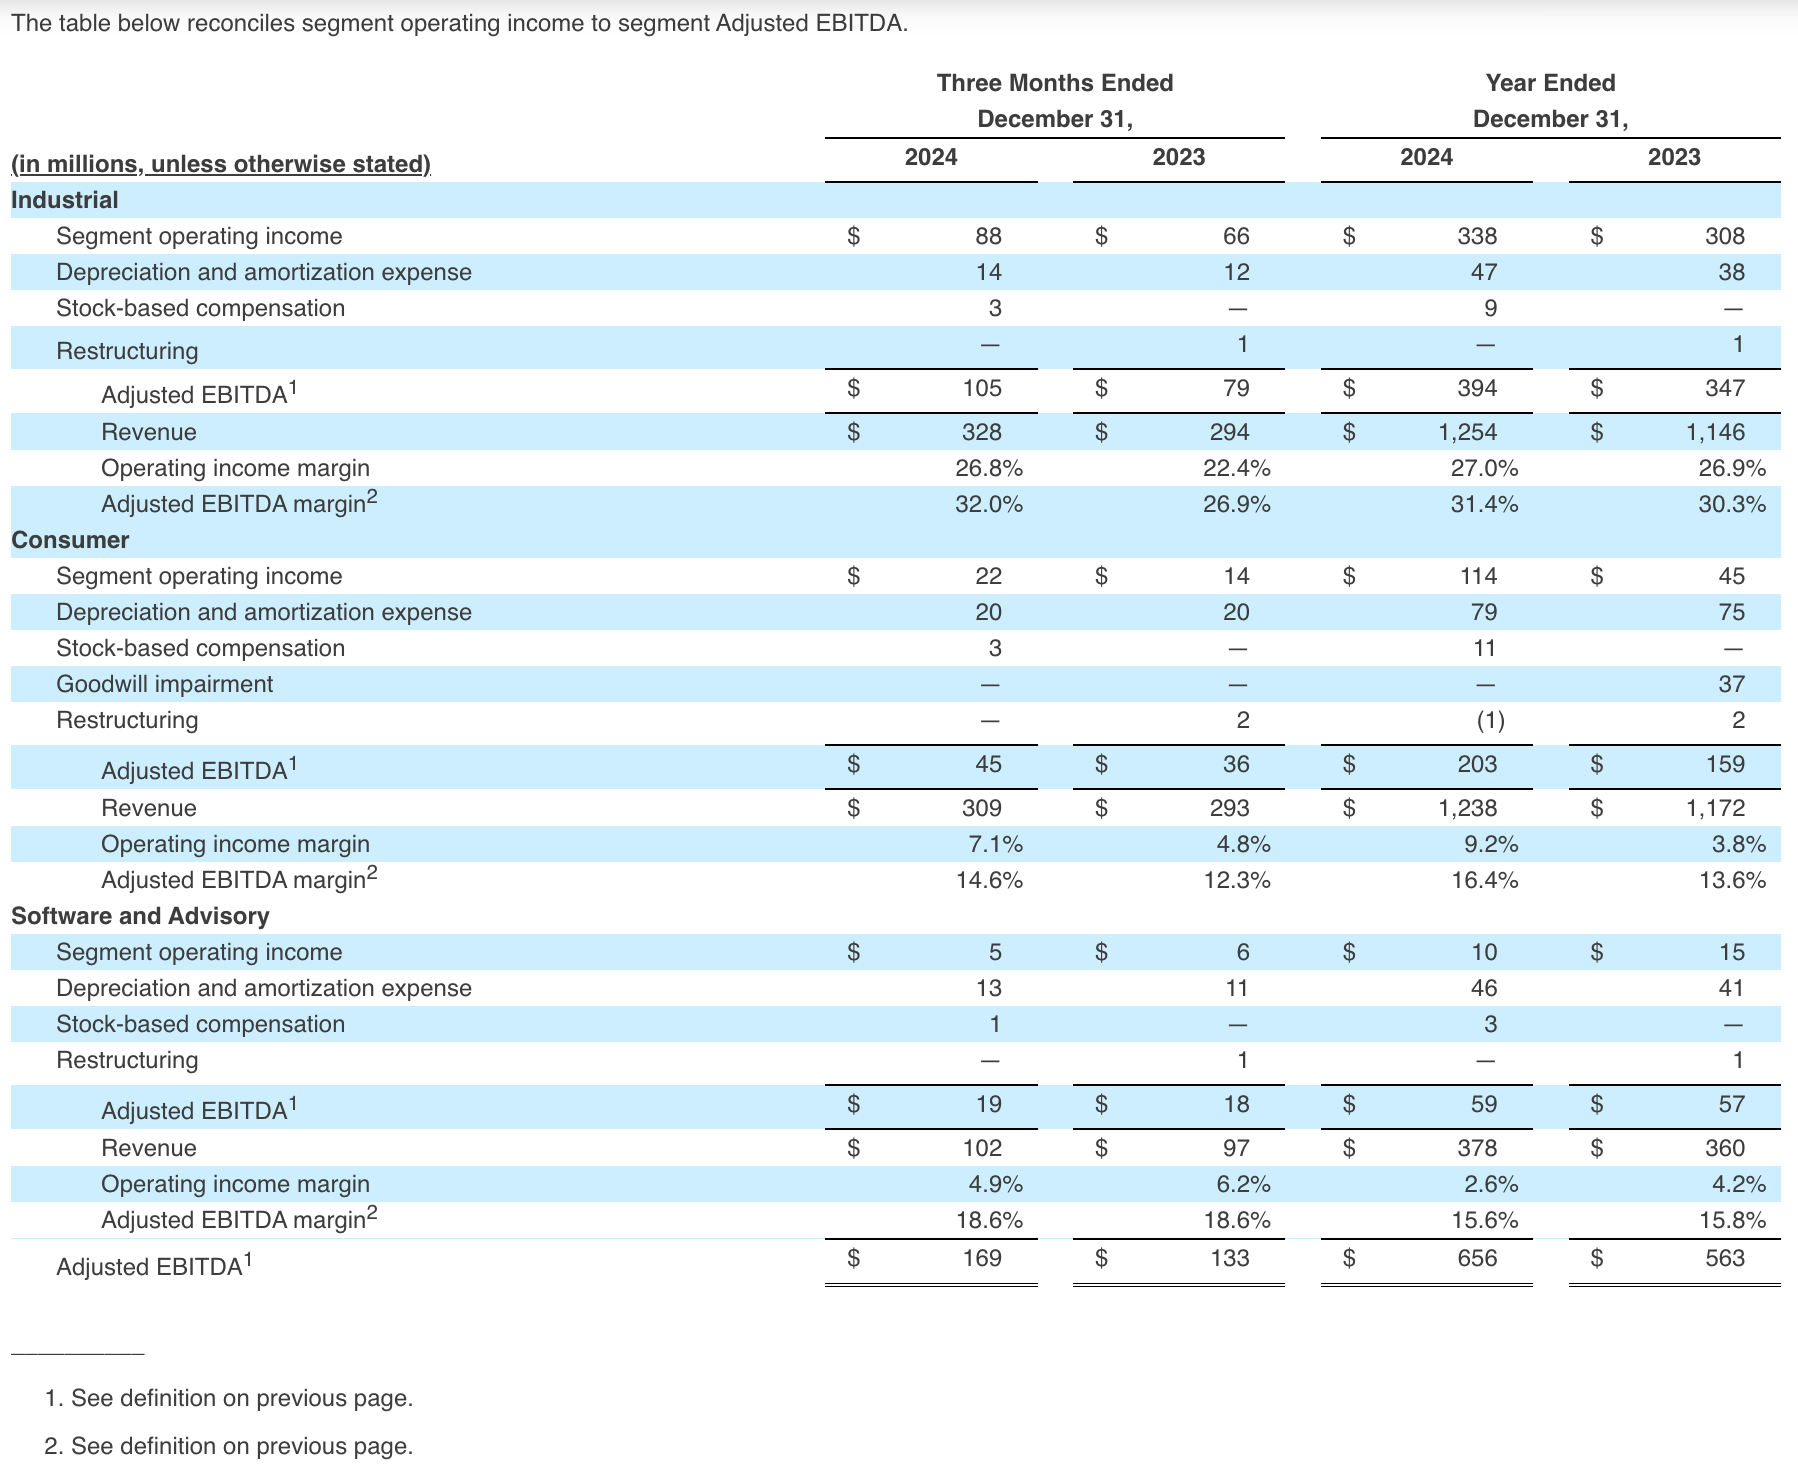
Industrial revenue of $328 million compared to $294 million in the fourth quarter of 2023, an increase of 11.6%, or 13.9% on an organic basis. Operating income of $88 million compared to $66 million in the fourth quarter of 2023. Operating income margin of 26.8% compared to 22.4% in the fourth quarter of 2023. Adjusted EBITDA of $105 million compared to $79 million in the fourth quarter of 2023, an increase of 32.9%. Adjusted EBITDA margin of 32.0% compared to 26.9% in the fourth quarter of 2023. Revenue gains were driven by continued demand related to electrical products, renewable energy and component certification testing and services, as well as increased laboratory capacity. Adjusted EBITDA gains and margin improvement were driven primarily by higher revenue and improved operating leverage.
Consumer Segment Results
Consumer revenue of $309 million compared to $293 million in the fourth quarter of 2023, an increase of 5.5%, or 6.5% on an organic basis. Operating income of $22 million compared to $14 million in the fourth quarter of 2023. Operating income margin of 7.1% compared to 4.8% in the fourth quarter of 2023. Adjusted EBITDA of $45 million compared to $36 million in the fourth quarter of 2023, an increase of 25.0%. Adjusted EBITDA margin of 14.6% compared to 12.3% in the fourth quarter of 2023. Revenue and Adjusted EBITDA gains were driven by retail and consumer technology. Margin improvement was driven by both higher revenue and improved operational efficiency.
Software and Advisory Segment Results
Software and Advisory revenue of $102 million compared to $97 million in the fourth quarter of 2023, an increase of 5.2% on a total and organic basis. Operating income of $5 million compared to $6 million in the fourth quarter of 2023. Operating income margin of 4.9% compared to 6.2% in fourth quarter of 2023. Adjusted EBITDA of $19 million compared to $18 million in the fourth quarter of 2023, a increase of 5.6%. Adjusted EBITDA margin of 18.6% was flat compared to the fourth quarter of 2023. Revenue gains were driven by increased software revenue. Margins were flat, primarily driven by higher services and materials expenses associated with professional fees.
Liquidity and Capital Resources
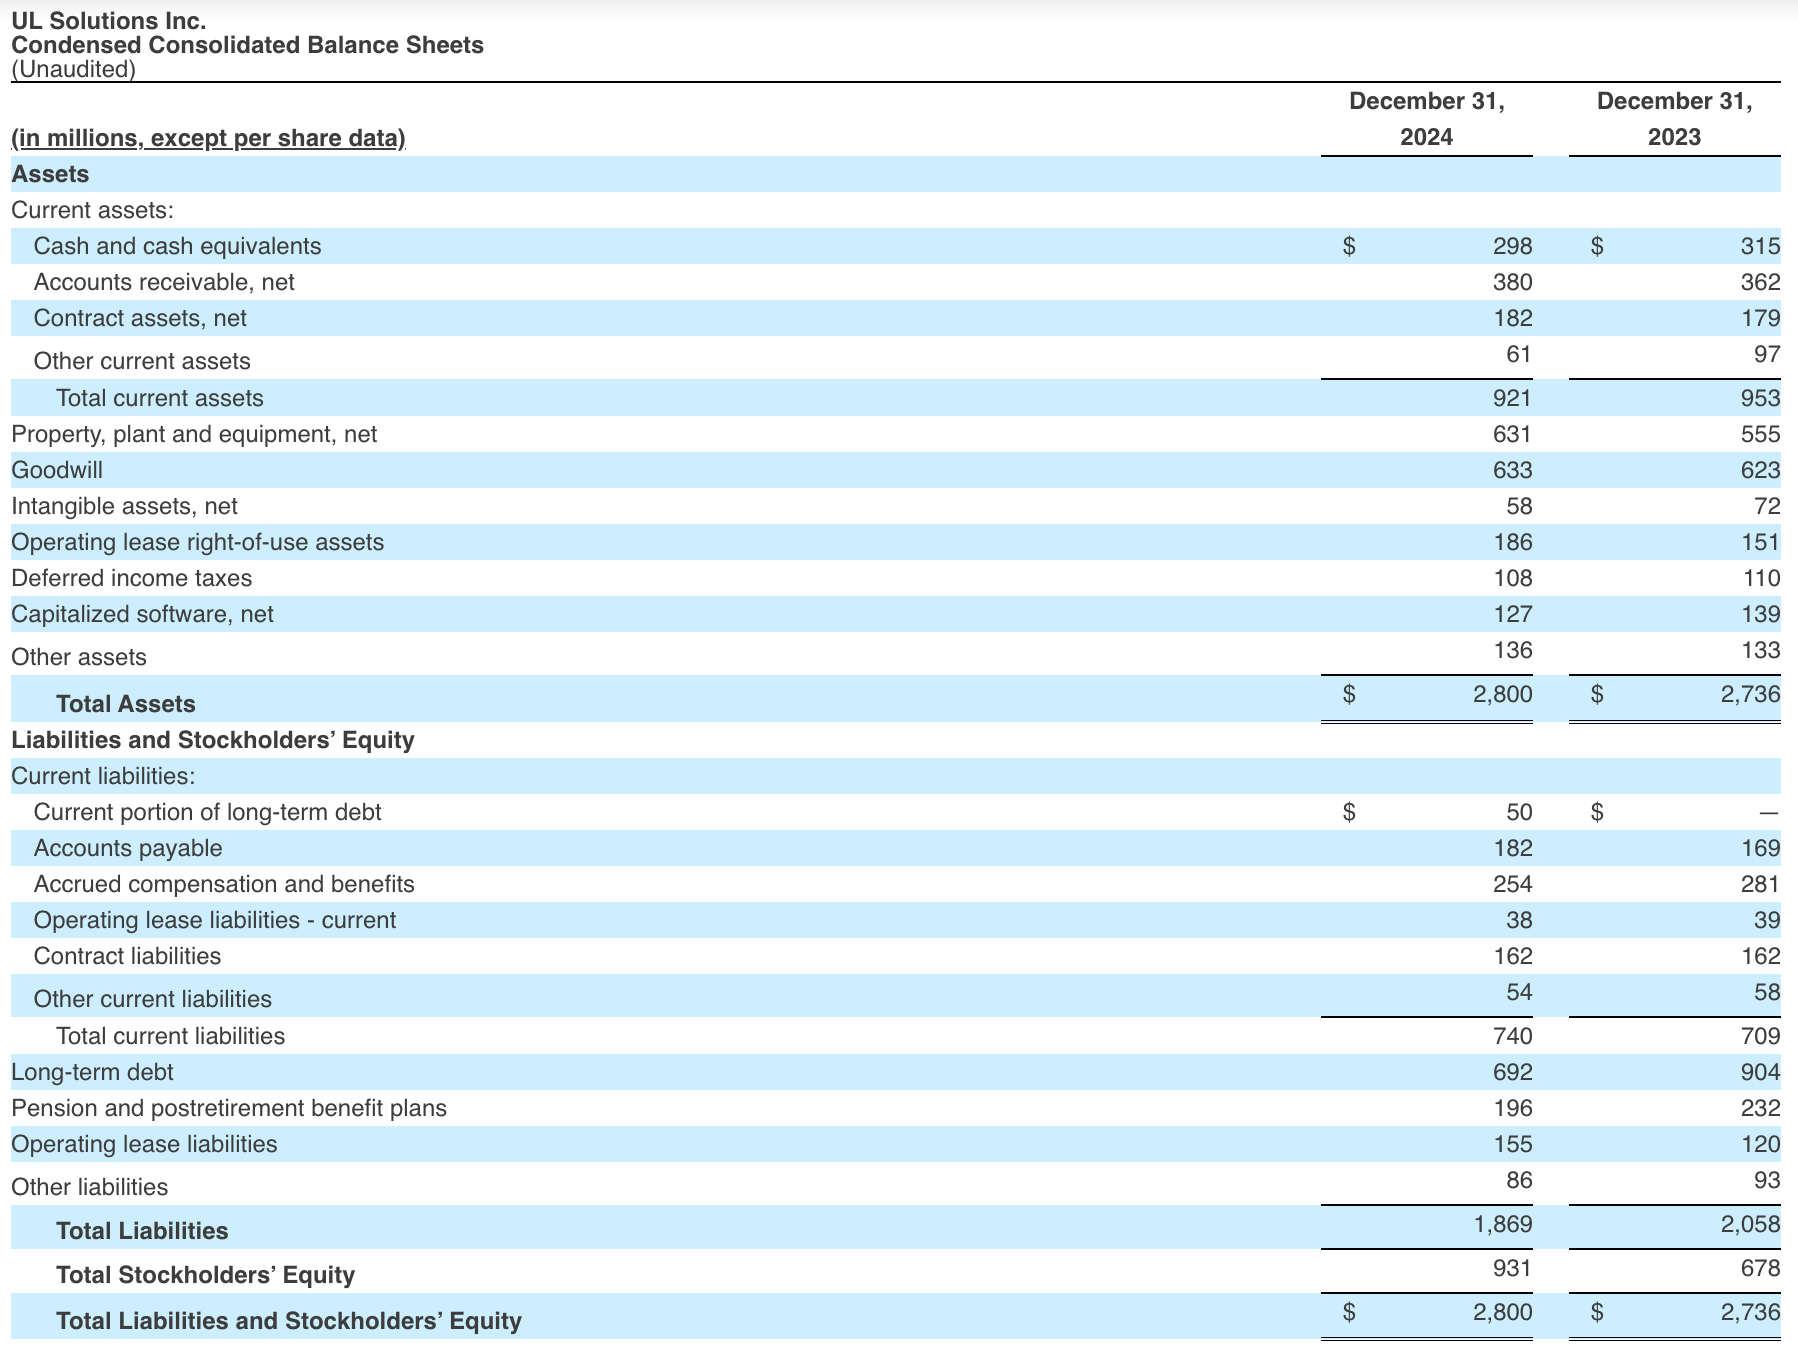
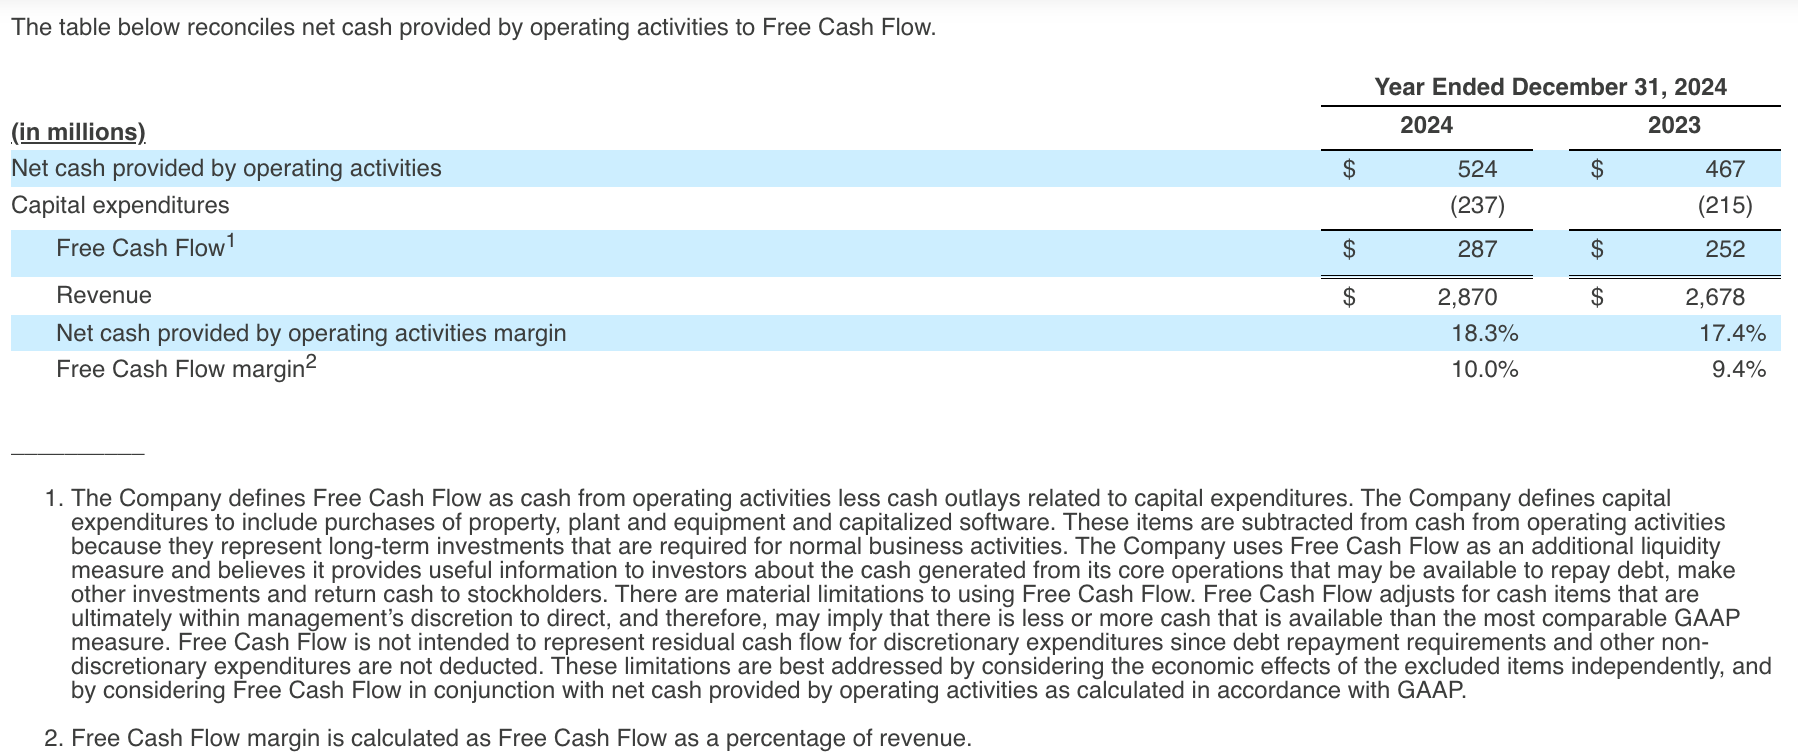
For the year ended December 31, 2024, the Company generated $524 million of net cash provided by operating activities, an increase from $467 million for the same period in 2023. Net cash provided by operating activities for the year ended December 31, 2024 was impacted by lower payments related to the Company’s cash-settled stock appreciation rights.
The Company continues to make strategic capital investments in energy transition opportunities to meet increased demand, and capital expenditures were $237 million, an increase from $215 million for the same period in 2023. Free Cash Flow for the year ended December 31, 2024 was $287 million, compared to $252 million for the same period in 2023.
The Company paid a dividend of $25 million during the three months ended December 31, 2024.
As of December 31, 2024, total debt was $747 million, prior to unamortized debt issuance costs, a decrease from December 31, 2023 due to $165 million of net repayments on the Company's revolving credit facility and term loan.
The Company ended the quarter with cash and cash-equivalents of $298 million compared to $315 million at December 31, 2023.
Full-Year 2025 Outlook
The Company’s key points on 2025 outlook include:
- Mid single digit constant currency organic revenue growth
- Adjusted EBITDA margin organic improvement to approximately 24%, in line with long term target
- Capital expenditures expected to be 7% to 8% of revenue
- Effective tax rate estimated to be approximately 26%
- Continuing to pursue acquisitions and portfolio refinements
The Company’s 2025 outlook is based on a number of assumptions that are subject to change and many of which are outside the control of the Company. If actual results vary from these assumptions, the Company’s expectations may change. There can be no assurance that the Company will achieve the results expressed by this outlook.
The Company does not provide guidance for net income margin, the most directly comparable GAAP measure to Adjusted EBITDA margin, and similarly cannot provide a reconciliation between its forecasted Adjusted EBITDA margin and net income margin without unreasonable effort due to the unavailability of reliable estimates for certain components of net income and the respective reconciliations. These forecasted items are not within the Company’s control, may vary greatly between periods and could significantly impact future financial results.
Conference Call and Webcast
UL Solutions will host a conference call today at 8:30 am ET to discuss the Company’s financial results. The live webcast of the conference call and accompanying presentation materials can be accessed through the UL Solutions Investor Relations website at ir.ul.com. For those unable to access the webcast, the conference call can be accessed by dialing 844-825-9789 or 412-317-5180. An archive of the webcast will be available on the Company’s website for 30 days.
About UL Solutions
A global leader in applied safety science, UL Solutions Inc. transforms safety, security and sustainability challenges into opportunities for customers in more than 100 countries. UL Solutions Inc. delivers testing, inspection and certification services, together with software products and advisory offerings, that support our customers’ product innovation and business growth. The UL Mark serves as a recognized symbol of trust in our customers’ products and reflects an unwavering commitment to advancing our safety mission. We help our customers innovate, launch new products and services, navigate global markets and complex supply chains, and grow sustainably and responsibly into the future. Our science is your advantage.
Investors and others should note that UL Solutions intends to routinely announce material information to investors and the marketplace using SEC filings, press releases, public conference calls, webcasts and the UL Solutions Investor Relations website. We also intend to use certain social media channels as a means of disclosing information about us and our products to consumers, our customers, investors and the public on our X account (@UL_Solutions) and our LinkedIn account (@ULSolutions). The information posted on social media channels is not incorporated by reference in this press release or in any other report or document we file with the SEC. While not all of the information that the Company posts to the UL Solutions Investor Relations website or to social media accounts is of a material nature, some information could be deemed to be material. Accordingly, the Company encourages investors, the media, and others interested in UL Solutions to review the information shared on our Investor Relations website at ir.ul.com and to regularly follow our social media accounts. Users can automatically receive email alerts and information about the Company by subscribing to “Investor Email Alerts” at the bottom of the UL Solutions Investor Relations website at ir.ul.com.
Forward-Looking Statements
Certain statements in this press release, which are not historical facts, are forward-looking statements within the meaning of the Private Securities Litigation Reform Act of 1995. These include statements regarding management’s objectives and the Company’s plans, strategy, outlook and future financial performance. In some cases, you can identify forward-looking statements by the use of words such as “may,” “could,” “seek,” “guidance,” “predict,” “potential,” “likely,” “believe,” “will,” “expect,” “anticipate,” “estimate,” “plan,” “intend,” “forecast,” “aim,” “objectives,” “target,” “outlook,” “guidance” and variations, or the negative, of these terms and similar expressions. Such forward-looking statements are necessarily based upon estimates and assumptions that, while management considers reasonable, are inherently uncertain.
There are many risks, uncertainties and other factors that could cause actual results to differ materially from those expressed or implied by the forward-looking statements made in this press release, including, but not limited to, the following: falsification of or tampering with our reports or certificates; increases in self-certification of products in industries in which we provide services or corresponding decreases in third-party certifications; any conflict of interest or perceived conflict of interest between our testing, inspection and certification services and our enterprise and advisory services; increased competition in industries in which we participate; ineffectiveness of our portfolio management techniques and strategies; adverse market conditions or adverse changes in the political, social or legal condition in the markets in which we operate; failure to effectively implement our growth strategies and initiatives; increased government regulation of industries in which we operate; adverse government actions in respect of our operations, including enforcement actions related to environmental, health and safety matters; failure to retain and increase capacity at our existing facilities or build new facilities in a timely and cost-effective manner; failure to comply with applicable laws and regulations in each jurisdiction in which we operate, including environmental laws and regulations; fluctuations in foreign currency exchange rates; imposition of or increases in customs duties and other tariffs; deterioration of relations between the United States and countries in which we operate, including China; changes in labor regulations in jurisdictions in which we operate; changes in labor relations and unionization efforts by our employees; failure to recruit, attract and retain key employees, including through the implementation of diversity, equity and inclusion initiatives, and the succession of senior management; failure to recruit, attract and retain sufficient qualified personnel to meet our customers’ needs; past and future acquisitions, joint ventures, investments and other strategic initiatives; increases in raw material prices, fuel prices and other operating costs; changes in services we deliver or products we use; inability to develop new solutions or the occurrence of defects, failures or delay with new and existing solutions; increase in uninsured losses; ineffectiveness of deficiencies in our enterprise risk management program; volatility in credit markets or changes in our credit rating; actions of our employees, agents, subcontractors, vendors and other business partners; failure to maintain relationships with our customers, vendors and business partners; consolidation of our customers and vendors; disruptions in our global supply chain; changes in access to data from external sources; pending and future litigation, including in respect of our testing, inspection and certification services; allegations concerning our failure to properly perform our offered services; changes in the regulatory environment for our industry or the industries of our customers; delays in obtaining, failure to obtain or the withdrawal or revocation of our licenses, approvals or other authorizations; changes in our accreditations, approvals, permits or delegations of authority; issues with the integrity of our data or the databases upon which we rely; failure to manage our SaaS hosting network infrastructure capacity or disruptions in such infrastructure; cybersecurity incidents and other technology disruptions; risks associated with intellectual property, including potential infringement; compliance with agreements and instruments governing our indebtedness and the incurrence of new indebtedness; interest rate increases; volatility in the price of our Class A common stock; actions taken by, and control exercised by, ULSE Inc., our parent and controlling stockholder; ineffectiveness in, or failure to maintain, our internal control over financial reporting; negative publicity or changes in industry reputation; changes in tax laws and regulations, resolution of tax disputes or imposition of audit examinations; failure to generate sufficient cash to service our indebtedness; constraints imposed on our ability to operate our business or make necessary capital investments due to our outstanding indebtedness; natural disasters and other catastrophic events, including pandemics and the rapid spread of contagious illnesses; and other risks discussed in our filings with the Securities and Exchange Commission (the “SEC”), including those set forth under Item 1A of our Annual Report on Form 10-K, as well as other factors described from time to time in our filings with the SEC.
All forward-looking statements attributable to us or persons acting on our behalf are expressly qualified in their entirety by the cautionary statements set forth above. We caution you not to place undue reliance on any forward-looking statements, which are made only as of the date of this press release. We do not undertake or assume any obligation to update publicly any of these forward-looking statements to reflect actual results, new information or future events, changes in assumptions or changes in other factors affecting such forward-looking statements, except to the extent required by law. If we update one or more forward-looking statements, no inference should be drawn that we will make additional updates with respect to those or other forward-looking statements.
Non-GAAP Measures
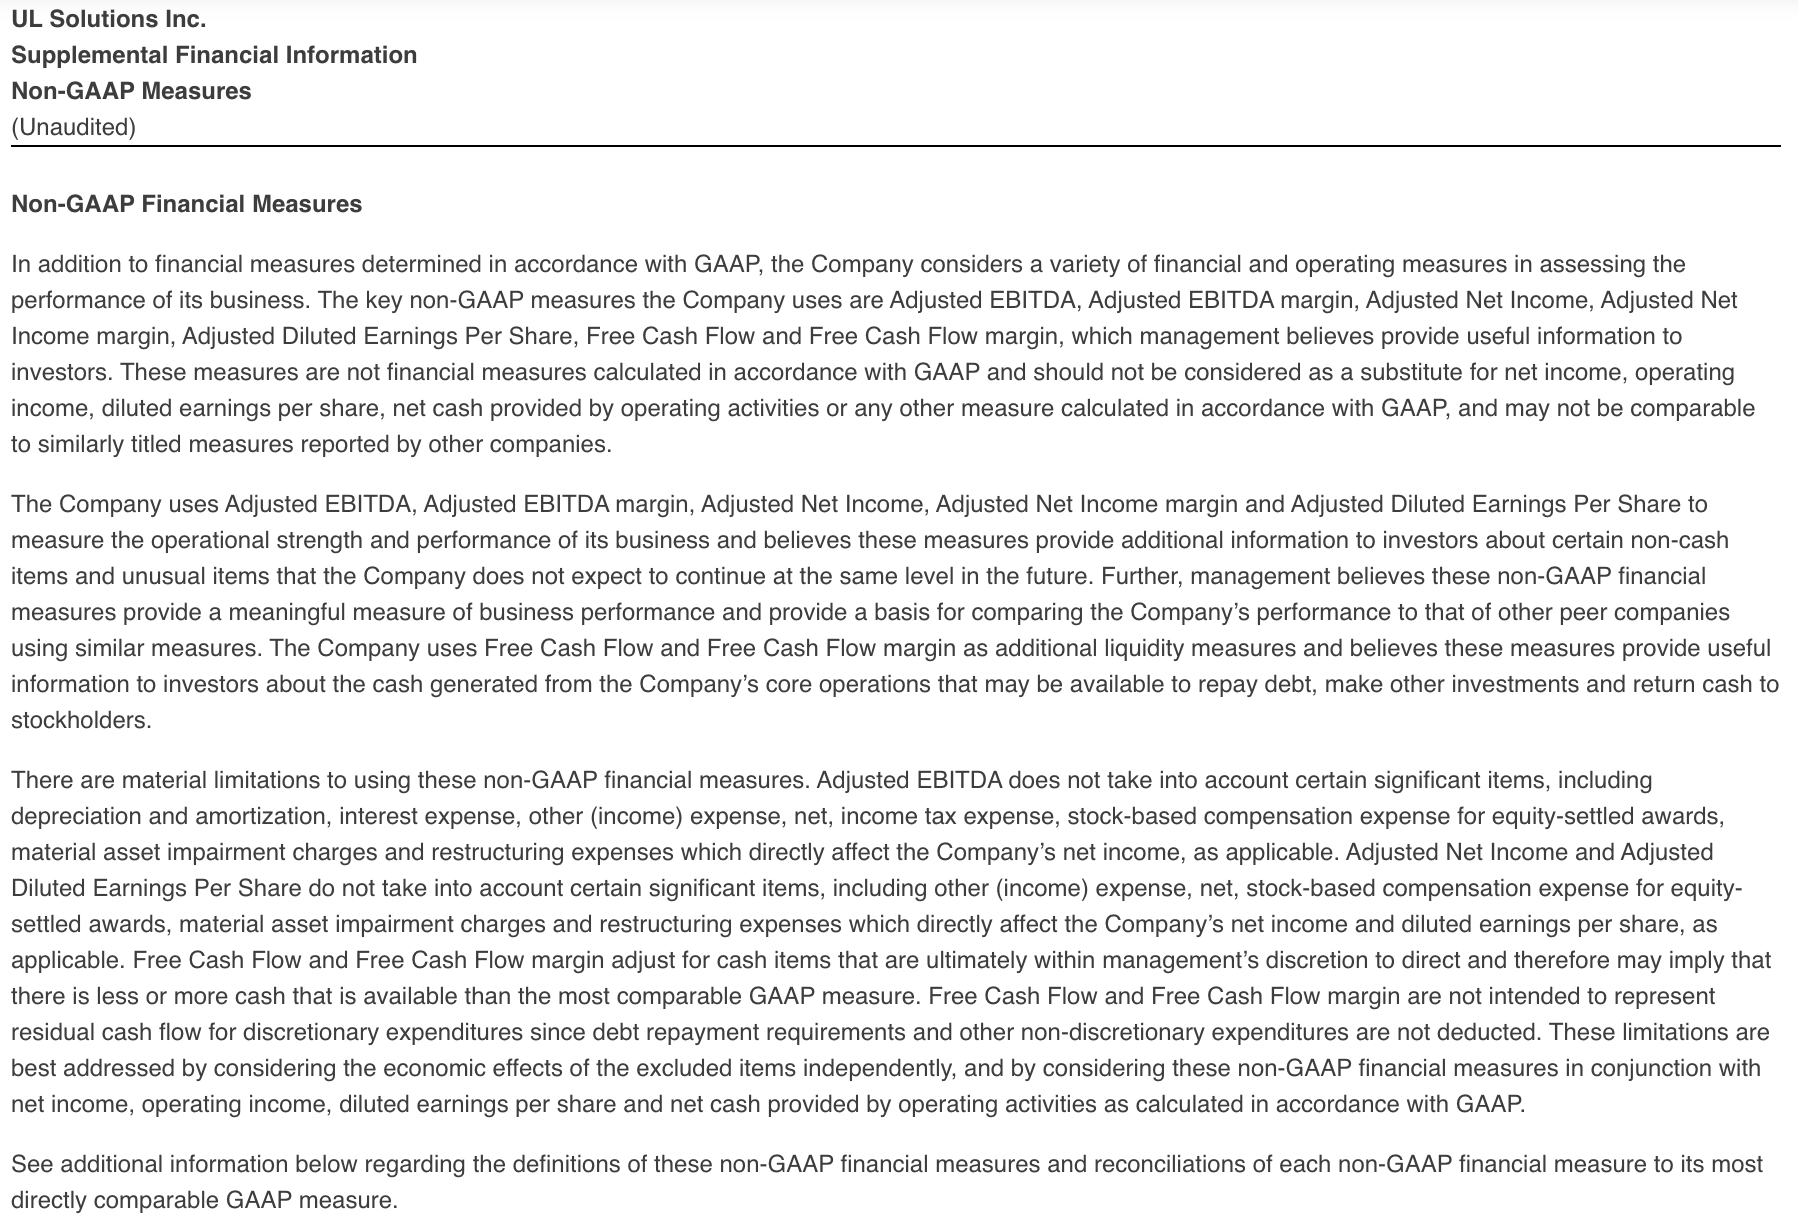
In addition to financial measures based on accounting principles generally accepted in the United States of America (“GAAP”), this press release includes supplemental non-GAAP financial information, including the presentation of Adjusted EBITDA, Adjusted EBITDA margin, Adjusted Net Income, Adjusted Net Income margin, Adjusted Diluted Earnings Per Share, Free Cash Flow and Free Cash Flow margin. Management uses non-GAAP measures in addition to GAAP measures to understand and compare operating results across periods and for forecasting and other purposes. Management believes these non-GAAP measures reflect results in a manner that enables, in some instances, more meaningful analysis of trends and facilitates comparison of results across periods. These non-GAAP financial measures have no standardized meaning presented in U.S. GAAP and may not be comparable to other similarly titled measures used by other companies due to potential differences between the companies in calculations. The use of these non-GAAP measures has limitations, and they should not be considered as substitutes for measures of financial performance and financial position as prepared in accordance with GAAP. See “Non-GAAP Financial Measures” below for definitions of these non-GAAP measures, and reconciliations to their most directly comparable GAAP measures.
Source Code: ULS-IR
Media:
Kathy Fieweger
Senior Vice President - Communications
Kathy.Fieweger@ul.com
+1 312-852-5156
Investors:
Dan Scott / Rodny Nacier, ICR Inc.
IR@ul.com
Source: UL Solutions Inc