
Streamline and simplify Scope 3 Category 1 data collection and reporting
Scope 3 emissions are typically the largest portion of an organization’s total emissions — they often account for more than 70% of an organization’s total carbon emissions.* Scope 3 Category 1 emissions represent the purchased goods and services that encompass the upstream supply chain activities linked to producing and delivering the goods and services your company procures, including:
The extensive energy-intensive production processes
The global network of suppliers and their regional nuances
The complexity of managing emissions across disparate data systems
The challenge:
Measure, manage, report and reduce Scope 3 emissions
Managing Scope 3 emissions data, specifically from purchased goods and services, is complex, with fragmented data, inconsistent formats and massive datasets spanning suppliers and regions. Siloed systems hinder visibility, making it hard to track progress or meet frameworks like the GHG Protocol.
ULTRUS Purchased Goods and Services module
Streamline your organization’s Scope 3 purchased goods and services data collection and reporting with the data-driven insights and actionable intelligence needed to improve your decarbonization initiatives.
ULTRUS™ software helps you manage Scope 3 Category 1 emissions data through the Purchased Goods and Services module, part of the UL 360 ESG and Sustainability platform. The module simplifies Scope 3 emissions data management by:
- Integrating with procurement systems to capture data efficiently
- Using precise emissions factors from spend-based to product-specific insights
- Highlighting emissions hot spots and opportunities for improvement
- Offering advanced visualization and reporting tools for clarity
This scalable, flexible and user-friendly solution helps organizations set targets, streamline reporting, and drive meaningful sustainability and financial resilience in a changing global economy.
Follow a seamless path to emissions reporting success
The Purchased Goods and Services module simplifies managing emissions from purchased goods and services through four key steps:
Data integration
Support seamless supplier and product list mapping while procuring procurement records from multiple sources to enhance efficiency and reliability.
Detailed emission calculations
Leverage preloaded or custom emission factors from trusted datasets like U.S. Environmentally-Extended Input-Output (USEEIO) and Exiobase, assigning the most specific factors for precision.
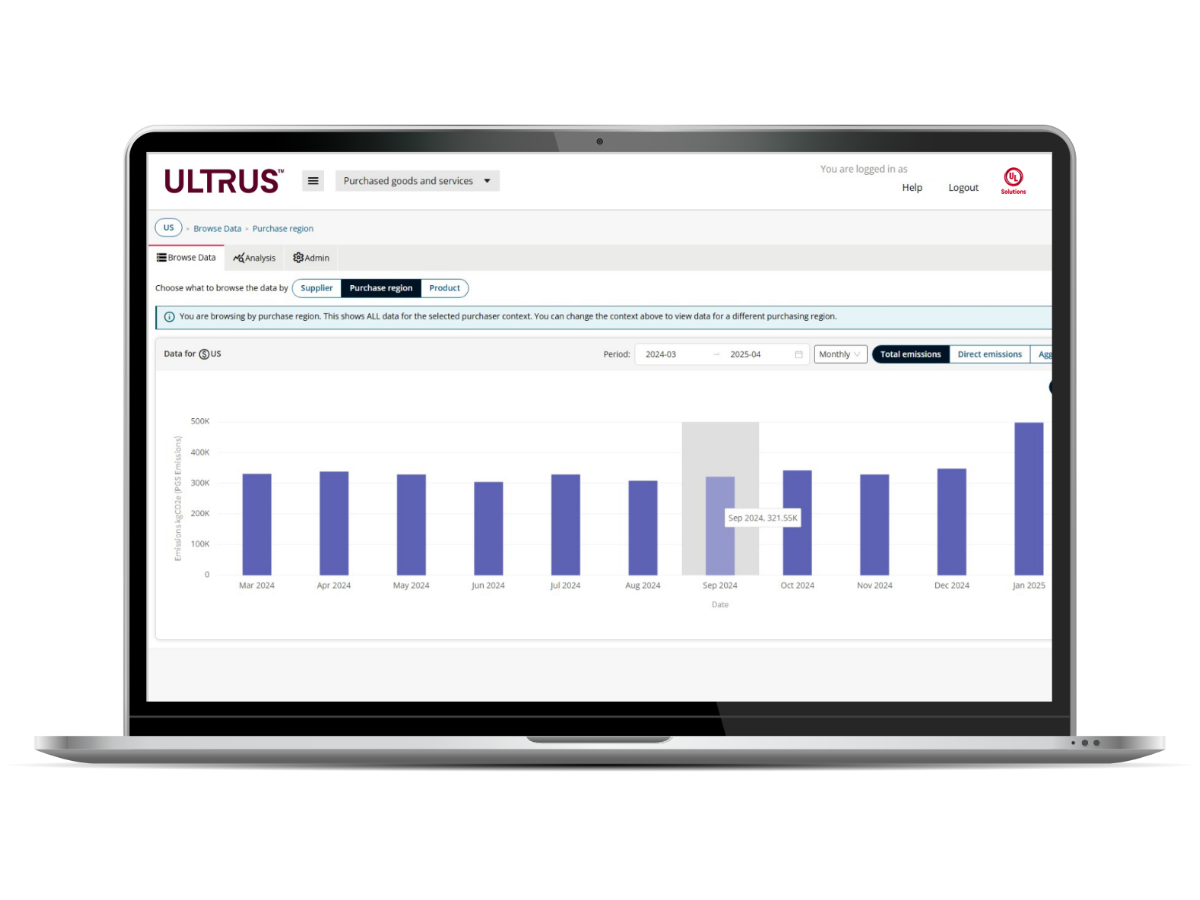
Visualization and analysis
Organizations can break down emissions data by supplier, product or region, gaining granular insights through monthly emissions breakdowns.
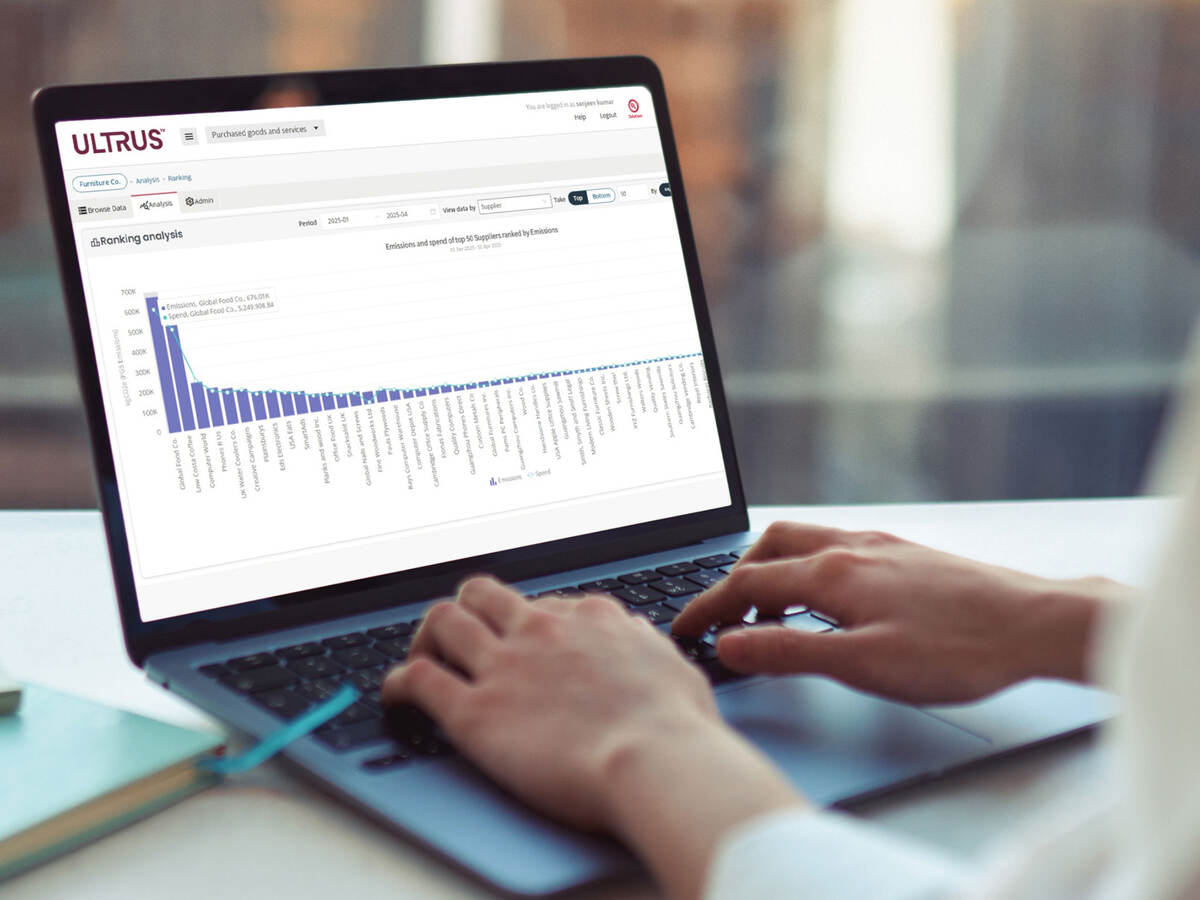
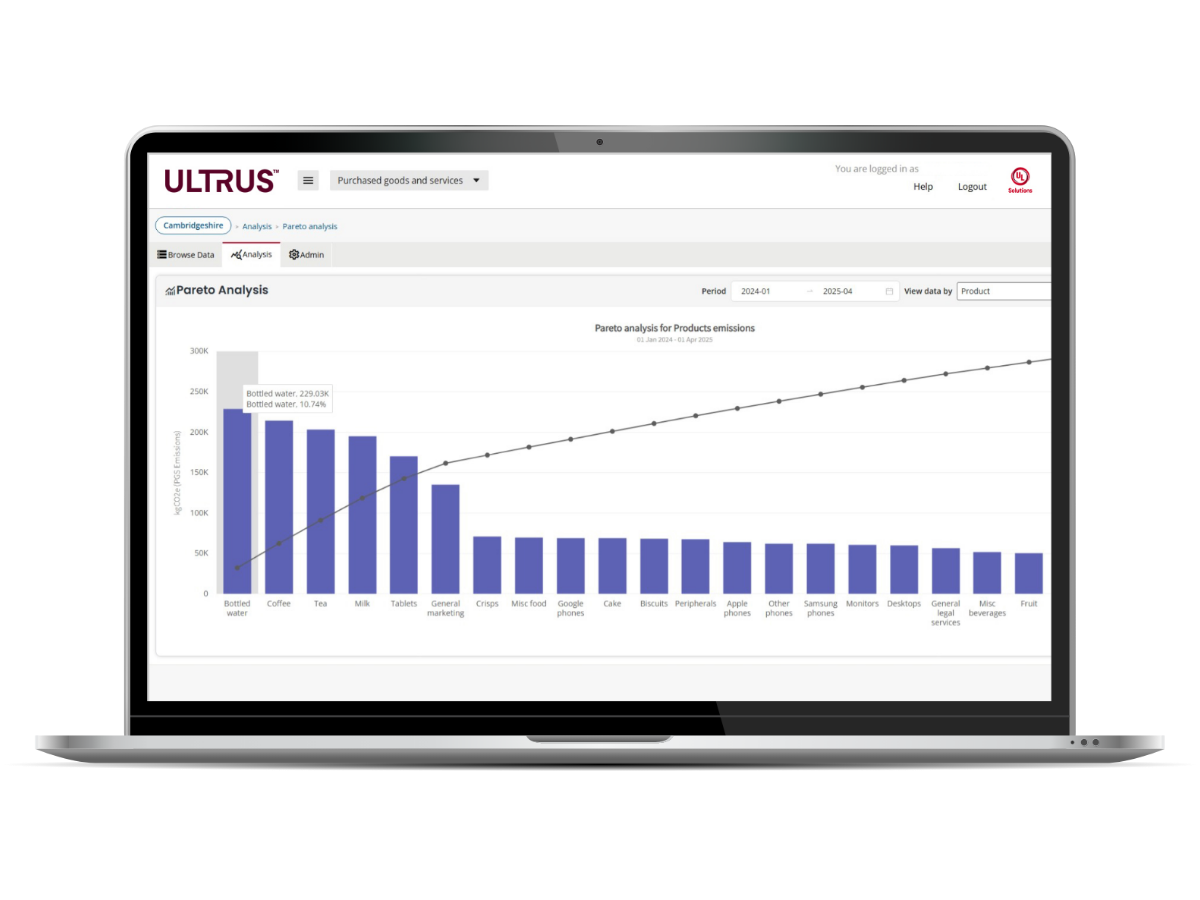
Actionable reporting
Enables easy data export and the creation of visualized reports tailored for stakeholders. Advanced tools, such as ranking and Pareto chart analysis, highlight opportunities for improvement to drive informed decision-making and identify key opportunities to drive decarbonization in your supply chain.
UL 360 software:
Your competitive advantage
What makes the UL 360 Purchased Goods and Services module stand out? It empowers your organization to meet sustainability goals and excel in driving decarbonization in your supply chain.
With superior scalability and performance, UL 360 software can efficiently handle millions of records at scale, allowing you to focus on growth without sacrificing system speed. Its flexible emission factor management lets you customize calculations to align with industry-specific goals and improve operational effectiveness. Plus, its powerful analysis tools uncover actionable insights into suppliers, products and regions, equipping you to make smarter, data-driven decisions.
Face Scope 3 challenges head-on, drive measurable decarbonization initiatives and build a more resilient, sustainable future with UL 360 platform, part of the ULTRUS software suite.
* Verdantix, (2024). Scope 3 Measurement: Mastering Emissions Reduction Strategies for Net Zero Success (Webinar).
Features and benefits
Detailed emission calculations
Achieve reliable greenhouse gas (GHG) emission results, empowering you to track and meet sustainability targets with confidence.
Flexible emission factor management
Tailor emission calculations to align with your industry goals, driving compliance and operational effectiveness.
Aggregated emission reporting
Streamline monthly emission summaries, enabling informed strategies for reducing environmental impact.
Real-time insights
Instantly spot emissions trends to incorporate into your sustainability strategy.
Powerful analysis tools
Uncover actionable insights into suppliers, products and regions to make smarter, data-driven decisions.

Scalability and performance
Handle millions of records seamlessly, enabling you to focus on growth without compromising efficiency.
Comprehensive data integration
Simplify supplier and regional data management, freeing time to focus on impactful sustainability initiatives.
Seamlessly connected purchase data
Efficiently consolidate purchase data from your enterprise resource planning and other procurement systems and analyze it all in one place for powerful insights.
Advanced visualization tools
Transform data into clear dashboards and Pareto graphs, providing transparency and easy communication of results.

Automated updates
Stay ahead with continuously updated data, reducing manual effort and facilitating accuracy in decision-making.
User-friendly interface
Navigate with ease and focus on what matters —turning insights into meaningful actions.

Integrate your supplier data
Automatically import factor updates from your suppliers when they become available. Adapt reports to meet regional standards, enhancing clarity and relevance for your stakeholders.
UL 360 and ULTRUS software
The Purchased Goods and Services module and other components of the UL 360 software are part of ULTRUS™ software portfolio, which brings together digital offerings from UL Solutions to help customers manage regulatory, supply chain and sustainability challenges.


X
Ready to take the next step?
See how our software can help you meet your needs now and into the future. Request a demo, quote, or speak with an expert.
Please wait…